Unit 4.2 Graphing Linear Equations
Graphing Linear Equations
Linear equations model a straight line when graphed on a Cartesian coordinate plane. You find two points that are located on the line and then are able to connect the line through them.
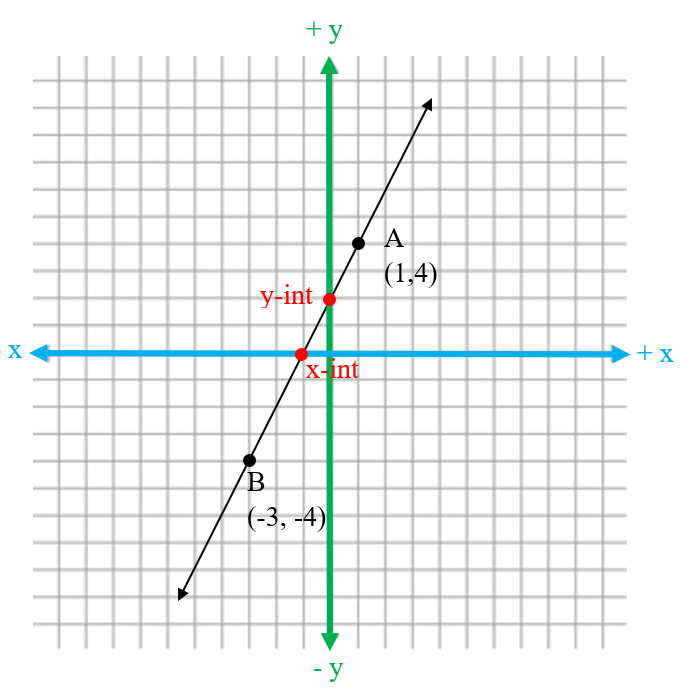
The line below passes through points A (1,4) and B (-3,-4)
You always need at least 2 points to graph a linear equation
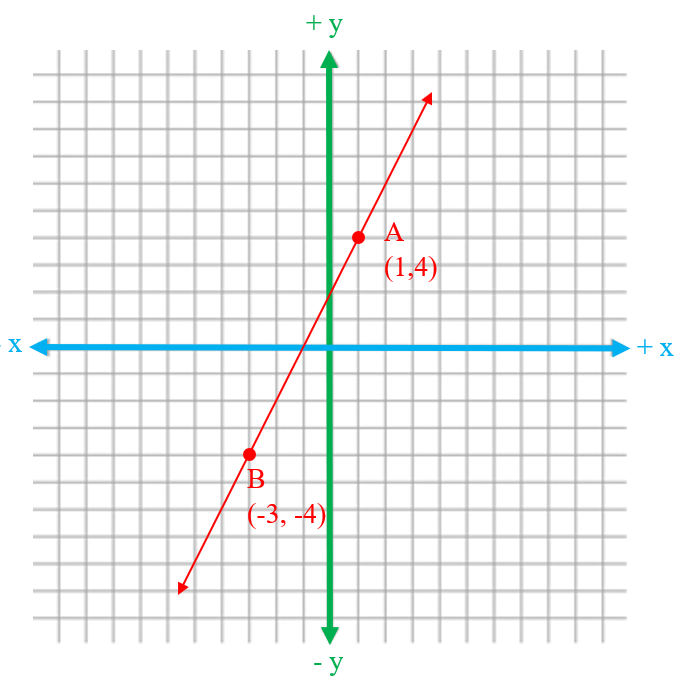
The linear equation for this line is y = 2x + 2. We can find points along the this line by plugging in values for x and getting a corresponding y value.
Finding a point on a line with a known x
Find a point on the line y = 2x + 2, where x = 2
y = 2 ( x ) + 2
y = 2 ( 2 ) + 2
y = 4 + 2
y = 6
When x = 2, y = 6. the ordered pair on this line is ( 2, 6 )
Any x value you plug into this equation will provide an ordered pair along this line. It is important to get y by itself first when using this method.
Intercepts
Lines also have places where they cross the x and y axis, these are called intercepts. Where the line crosses the y axis is called the y-intercept and where it crosses the x-axis is called the x-intercept
Where the y-intercept occurs, the x-coordinate value will equal zero
y intercept = (x,0)
Where the x-intercept occurs, the y-coordinate value will equal zero
x intercept = (0,y)
You can find these intercept values by plugging in zero for the opposite variable
y – intercept
For the line y = 2x + 2 find the y intercept (find y when x = 0)
y = 2x + 2
y = 2 (0) + 2
y = 2
The y intercept is (0,2)
x – intercept
For the line y = 2x + 2 find the x intercept (find x when y = 0)
y = 2x + 2
0 = 2x + 2
-2 = 2x
x = -1
The x intercept is (-1,0)
If we look at our graph, we can see the intercepts match with what we found