Unit 13.3 Systems of Linear Inequalities
Linear Inequalities and Systems of Linear Inequalities
See Unit 4.5 for a refresher on linear inequalities
A system of linear inequalities is a set of two or more linear inequalities with the same variables. The solution to a system of linear inequalities is the set of all points that satisfy all inequalities in the system simultaneously.
Graphing a System of Linear Inequalities
To solve a system of linear inequalities, we can graph each inequality on the same coordinate plane and identify the region where all the inequalities overlap. Start by graphing each linear inequality individually and shading its region. Where the two overlap is called the “feasible” region.
When graphing linear inequalities, remember that a dashed line represents non inclusivity ( > and <) where a solid line indicates inclusivity (≥ and ≤)
Graphing a system of linear inequalities
Graph and find the feasible region for
y ≤ 2x + 1
y > x + 2
x > 0 and y > 0
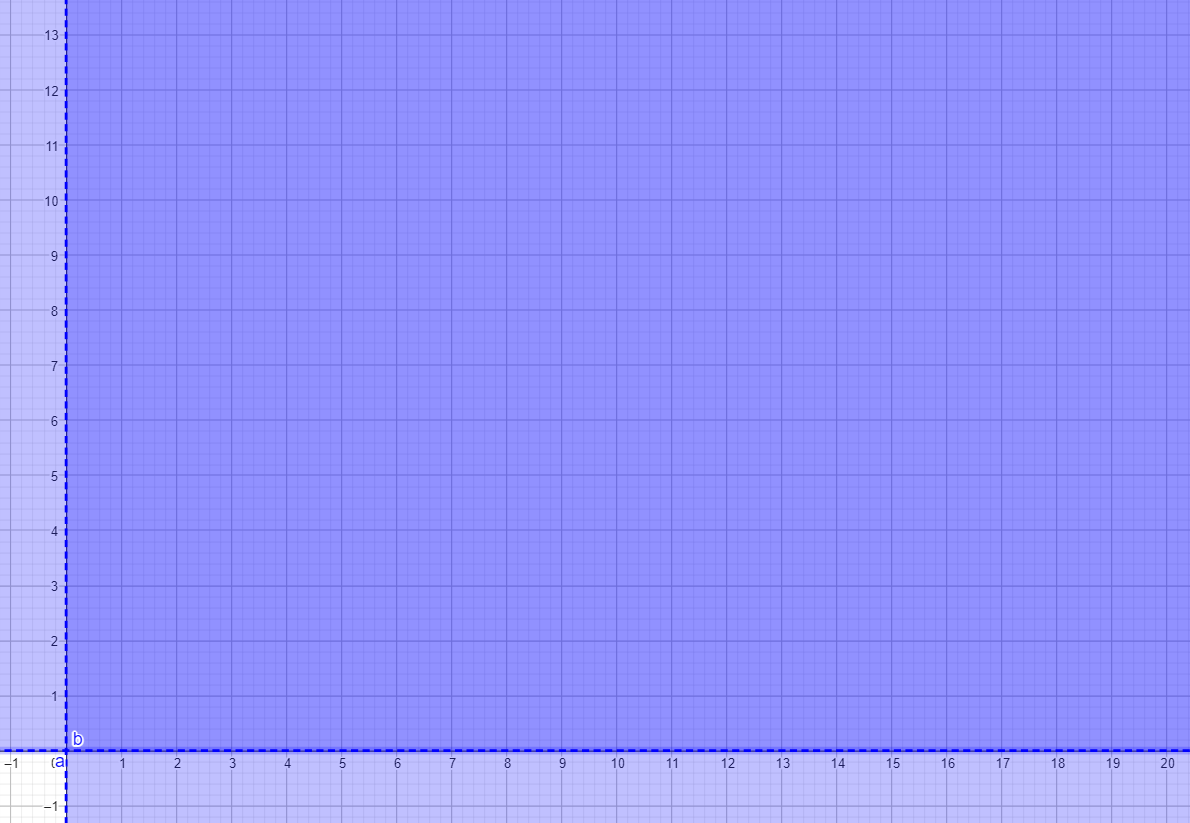
Looking at our constraints, lets start with x > 0 and y > 0. That means that the negative regions on the x and y axis are not included
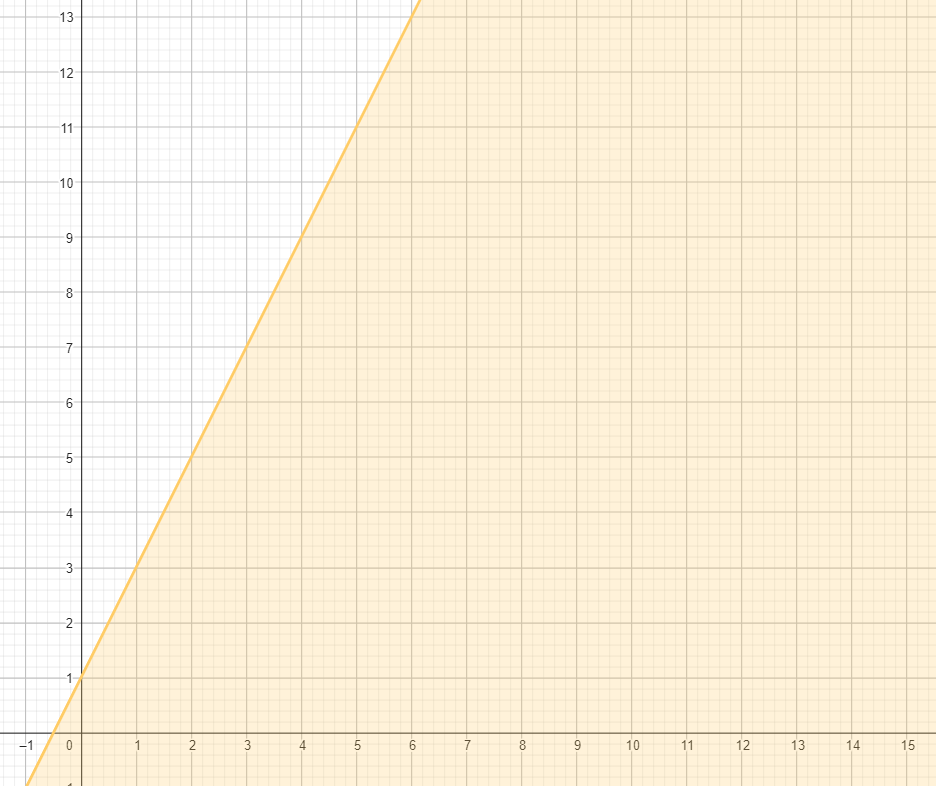
Graph y ≤ 2x + 1. the line contains the ordered pairs (1,3) and (4,9). Since it is inclusive, it will get a solid line
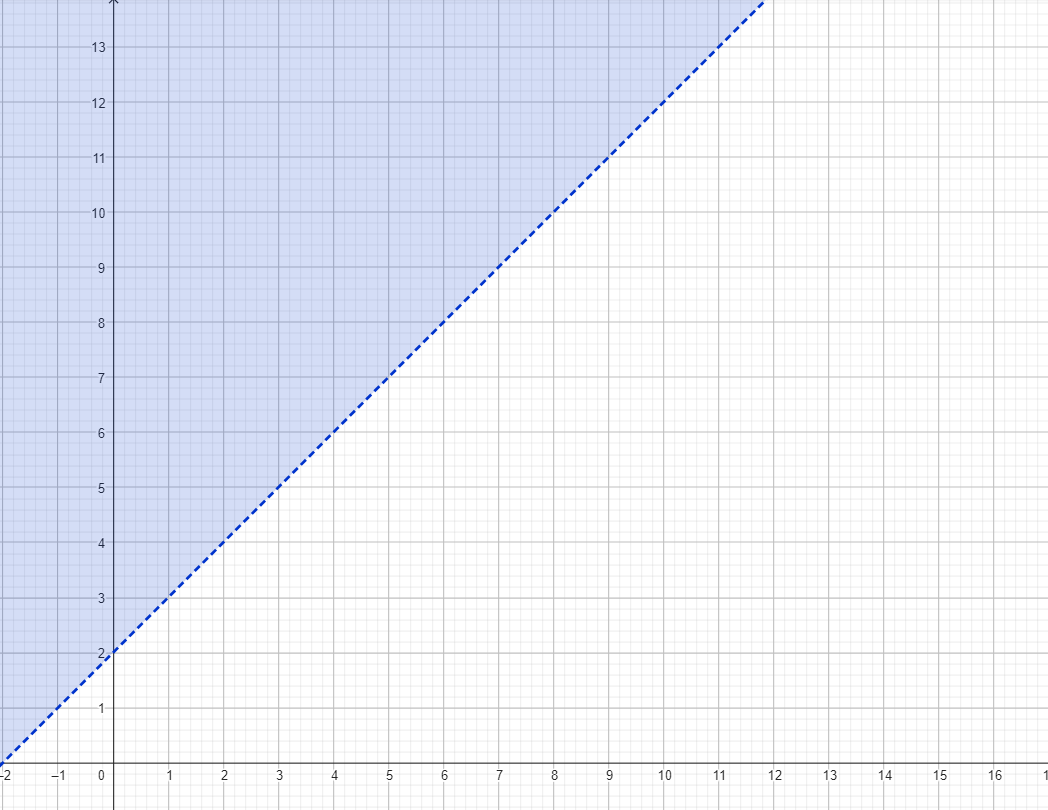
Graph y > x + 2. It contains the ordered pairs (1, 3) and (2, 4). Since it is non inclusive, it will get a dashed line
Graph all the lines together and determine where they overlap
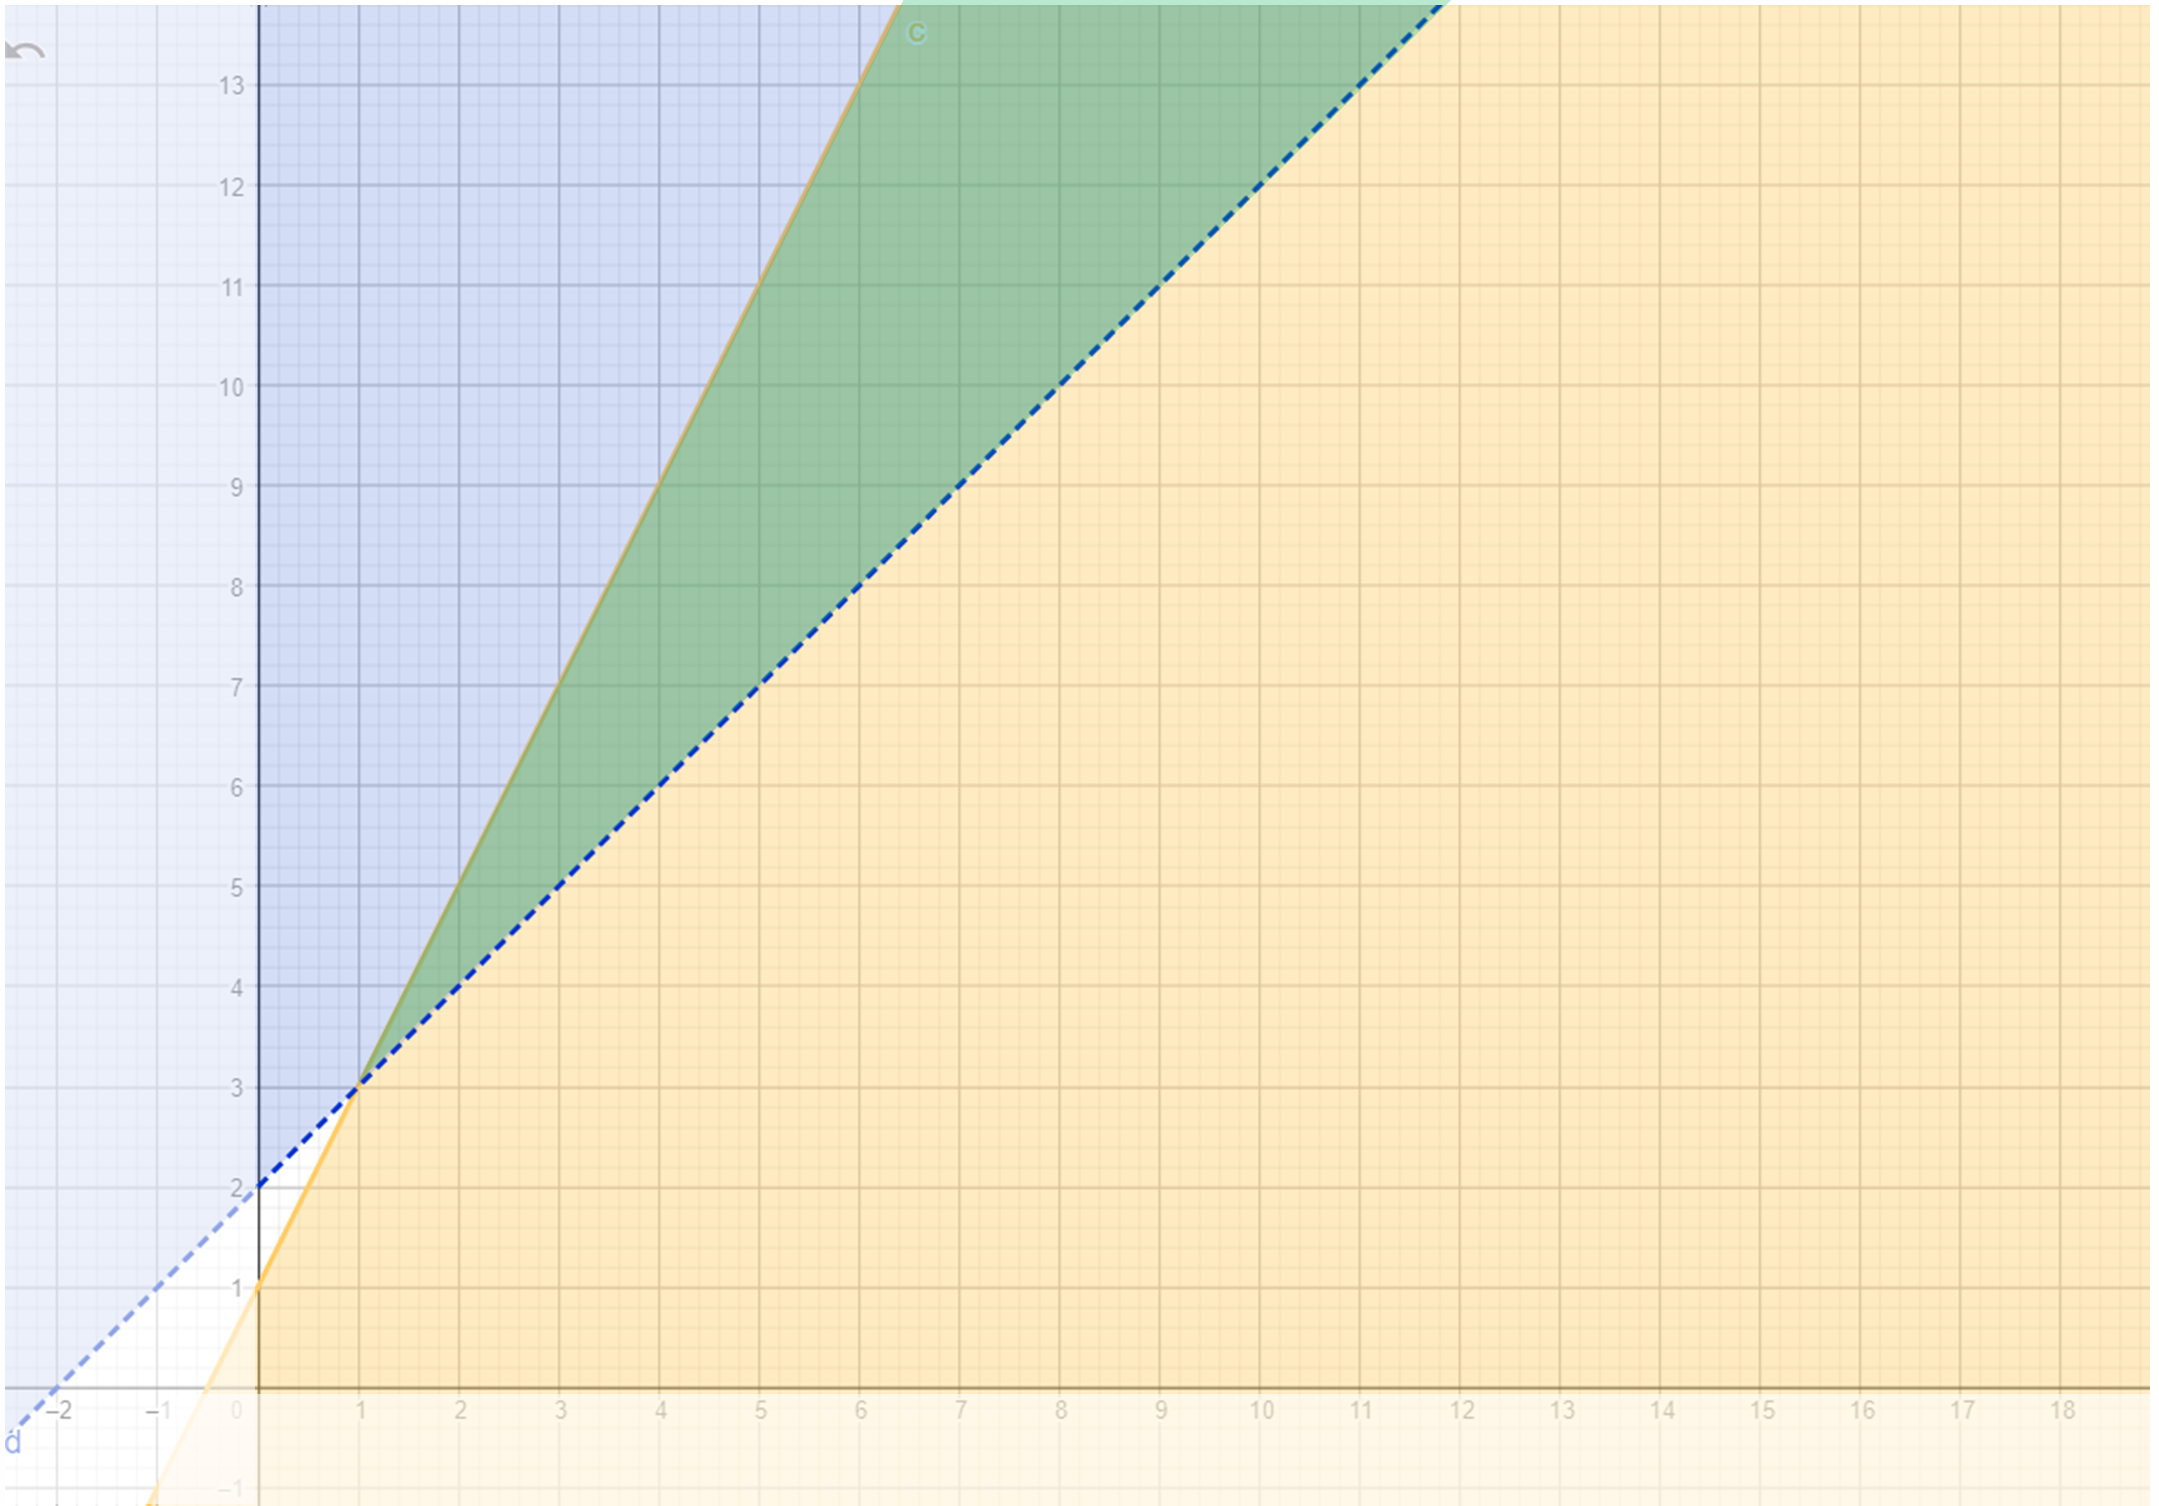
Since none of the solutions fall outside of x > 0 and y > 0 all the solutions within the green area are valid.