Chapter 12 Earthquakes
12.7 Monitoring Earthquake Activity in Yellowstone
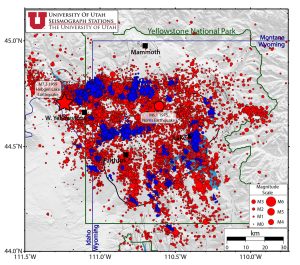
The Yellowstone region is one of the most seismically active areas in the United States (Figure 12.7.1). It experiences an average of around 1,500 to 2,500 located earthquakes per year! The majority of these earthquakes are too small to be felt by humans but are detected by a sophisticated network of about 50 seismometers called the Yellowstone Seismic Network (YSN).
Monitoring Earthquakes in Yellowstone National Park
The University of Utah Seismograph Stations (UUSS) operates YSN, and earthquake data are transferred from Yellowstone to the UUSS in real time using a radio and satellite telemetry system. UUSS scientists analyze the earthquake data and report information out via their website.
It is challenging to keep data flowing during harsh winter months, because many of the transmission sites are on tall peaks that experience heavy snowfall and frigid temperatures. Seismometers sometimes go down for short periods of time because the solar panels or antennas get covered in snow and ice. Seismometers that go down during the winter may not be accessible until the spring.
Since 1973, there have been over 48,000 earthquakes located in the Yellowstone region. Over 99% of those earthquakes are magnitude 2 or below and are not felt by anyone. Earthquake swarms (earthquakes that cluster in time and space) account for about 50% of the total seismicity in Yellowstone and can occur anywhere in the Yellowstone region, but they are most common in the east-west band of seismicity between Hebgen Lake and the Norris Geyser Basin. Most swarms are small, containing 10-20 earthquakes, and short, lasting for 1–2 days. However, large swarms that can contain 1,000’s of earthquakes and last for months do occur on occasion.
What is “Normal” Earthquake Activity in Yellowstone?
In the monthly seismicity reports for Yellowstone, it is common to read the statement, “earthquake activity in Yellowstone remains at background levels”. In fact, in the USGS monthly activity reports, there is an alert level assigned to each volcano, Yellowstone included. The “normal” alert level is associated with a “non-erupting volcano that is exhibiting typical background activity”. The “advisory” alert level is associated with a “volcano that is exhibiting signs of elevated unrest above known background activity”. So, the question is, how do we know what is normal versus something that may be associated with a possible eruption?
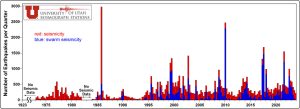
In terms of earthquake activity in the Yellowstone region, it is typical for Yellowstone Volcano Observatory (YVO) to state that the area experiences 1,500–2,500 earthquakes per year. These numbers are based on seismicity over the last ~30 years (1995–present). During that time period, the year with the most earthquakes is 2017, with 3,427 events, and the year with the least number of earthquakes is 2011, with 708 events. As with most natural systems, Yellowstone doesn’t behave in a linear or predictable fashion, so simply taking the average number of annual earthquakes wouldn’t represent the range that is characteristic of such a dynamic system.
One of the reasons why the annual number of earthquakes has such a large range is because roughly half of Yellowstone earthquakes occur as part of earthquake swarms—groupings of seismic events that are clustered in both time and space. Individual swarms can have as little as 10 events and last for less than an hour or up to thousands of events and last for many months (the 2017 Maple Creek swarm is an example). Typically, years with high numbers of earthquakes, like 2017, have been characterized by large swarms.
Another thing you may be wondering: Yellowstone has been seismically monitored since the early 1970s, so why is the range of “normal” seismic activity based on 1995–present? This is because the seismic network has grown and improved over the years. If you look at a plot of earthquakes over time, you can see an apparent increase in seismicity around the year 1995. Prior to 1995, the Yellowstone Seismic Network had fewer stations. Around 1995, the network was upgraded substantially with not only additional stations, but also stations with newer technology (including data transmission) that allowed for the identification and location of more earthquakes (typically smaller magnitude events). Those earthquakes were always happening, but prior to this upgrade in the network we were unable to locate them. So, the apparent increase in seismicity rate around 1995 is not real; it is simply because the better network allowed us to identify and locate more of the seismicity that was occurring.
Even though researchers continue to improve the Yellowstone Seismic Network, the network since 1995 has had the coverage needed to detect most earthquakes occurring in the region. Seismicity rate changes since 1995 are therefore most-likely representative of real variation in the system.
Volcanic systems like Yellowstone are naturally dynamic; however, there are patterns over time that can be determined by careful monitoring and study. The longer researchers have monitoring equipment that records earthquake activity (and other tectonic, hydrothermal, and volcanic signals), the more likely that they will be able to identify periods of “unusual” behavior. But, just because there is elevated seismicity (above the average), doesn’t mean that an eruption is imminent, regardless of what you may see online.
Media attributions
- Monitoring Earthquakes in Yellowstone National Park
- What is “Normal” Earthquake Behavior in Yellowstone National Park, by Jamie Farrell with minor edits by Ryan Anderson
- Figure 12.7.1 USGS, Public Domain
- Figure 12.7.2 Jamie Farrell, University of Utah, Public Domain
